Skip to content
Murray Acoustics
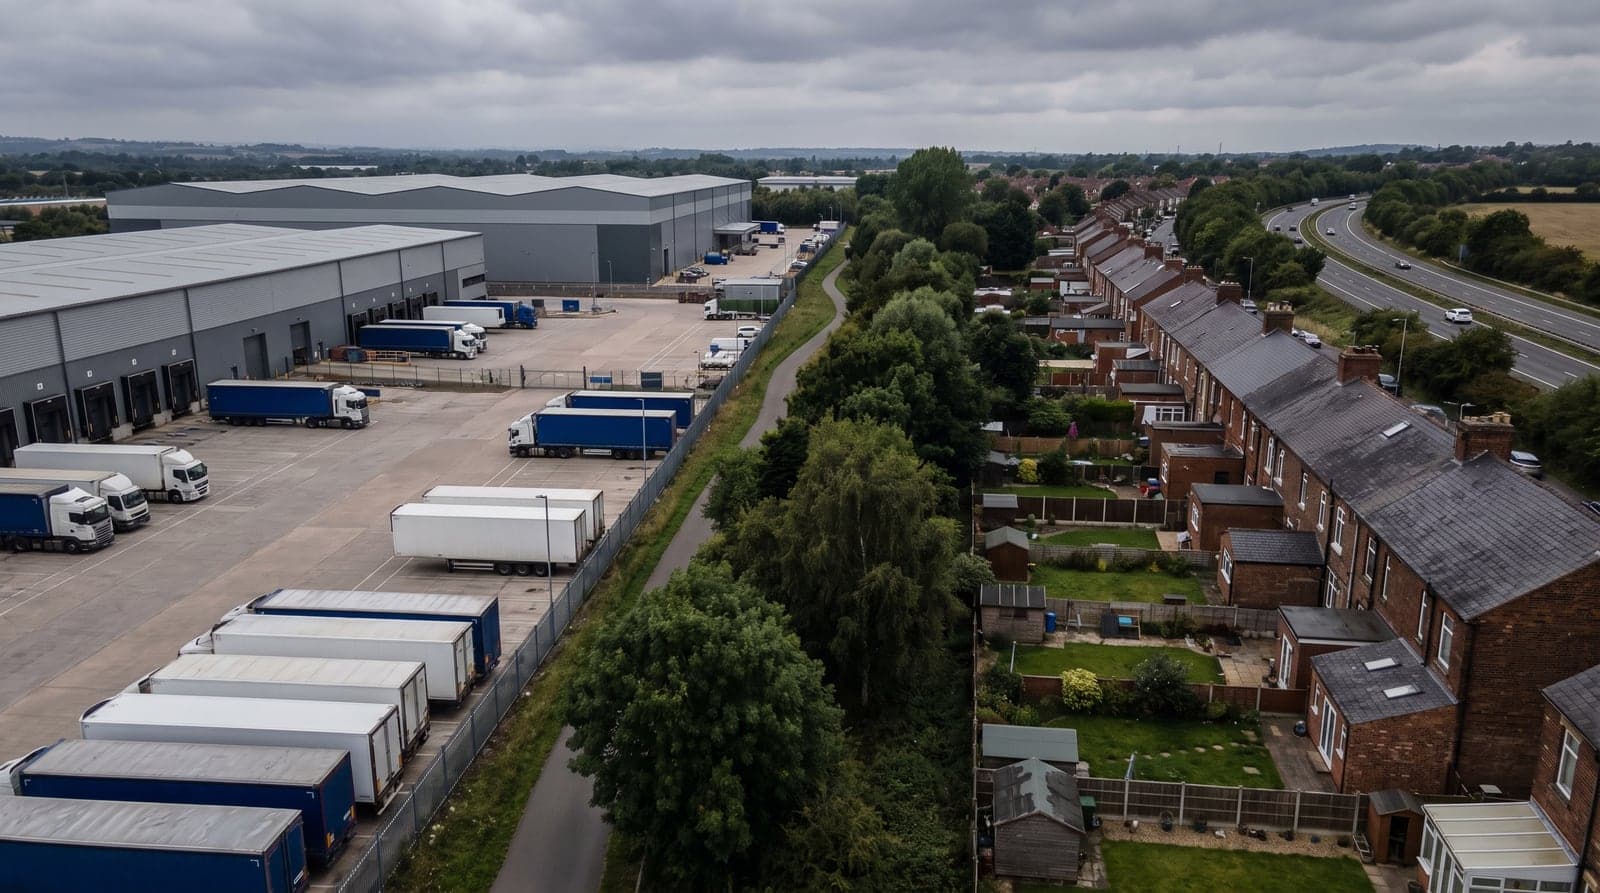
A distribution park and its lorry yard backing directly onto residential gardens

Noise Modelling & Mapping

Noise modelling: when a spreadsheet stops being enough.

Three-dimensional acoustic models and noise contour maps, for schemes too complex to answer with a calculation.

Fixed fee agreed up front · Quote back the same working day

The service

What it is, and when you need it.

Some sites can be answered with a calculation on one page. Others have twelve sources, thirty receptors, a barrier and a change in ground level, and need a model.

A masterplan or multi-phase scheme

Where levels need to be established across a whole site and at many receptors, not at a single facade.

Several sources at once

Road, rail and industrial sources contributing to the same receptors, where the cumulative answer is the only meaningful one.

Mitigation that needs optioneering

Barrier heights, bund positions, plant locations and building layouts, tested against each other before anything is committed.

A prediction that needs checking

Where an approved assessment's conclusions do not match what people are experiencing, a calibrated model shows why.

What you get

What the fee covers.

One fee, fixed before anything starts. Everything listed here is inside it.

Written to

  • A three-dimensional model of the site: geometry, buildings, ground, barriers and screening
  • Source data from measurement, manufacturer information or standard databases
  • Calculation to ISO 9613-2 for industrial sources and CRTN for road traffic, as applicable
  • Noise contour maps at the heights that matter, typically ground floor and upper floor receptors
  • Scenario comparison, so the effect of each mitigation option is shown rather than asserted
  • Fixed fee agreed up front. No day rates, no extras

What a model is actually for

A model is not a more impressive way of producing the same number. It answers questions a hand calculation cannot: what happens at the fourteenth floor as against the ground, how much a barrier gains once diffraction over the top is accounted for, which of four plant positions gives the best outcome, and what the combined effect of several sources is at a receptor each one individually satisfies.

It is also the only practical way to present results across an area. A contour map shows a planning officer immediately where a scheme works and where it does not, which is considerably more persuasive than a table of receptor levels.
A model is only as good as its inputs

The most important thing about modelling is the least impressive: source data. A model built on optimistic sound power figures produces confident, precise, wrong answers, and the software gives no clue that anything is amiss. This is the single most common failure we find when reviewing other people's work.

Where it matters, we calibrate. Measuring the actual installed source, or measuring at a known receptor and adjusting the source terms until the model reproduces reality, converts a model from a prediction into evidence. On the Astley Business Park survey we ran two scenarios through an identical model, one using the approved assessment's source data and one calibrated to measurement, so that the difference between them could only be attributable to the source terms.

How a modelling job runs

The model is built from what already exists on your project: site layout and elevation drawings, a topographical survey where levels matter, and the plant schedule or traffic data for the sources. Where the site is live, a measurement visit pins the model to reality; where it is unbuilt, standard source databases and manufacturer data fill the gaps, stated as such so the officer can see which numbers are measured and which are predicted.

Once the geometry and sources are in, the scenarios are cheap. That is the real economy of modelling: the expensive part is building the site once, after which testing a taller barrier, a relocated plant deck or a re-orientated block is a matter of hours. We would rather run six options at design stage than defend one option at committee, and the fee is structured to encourage exactly that.

The deliverable is the figures your report needs: contour plots at the receptor heights that matter, tables at each assessed facade, and the scenario comparisons laid side by side. Where the model supports a BS 4142 or BS 8233 assessment, the modelling and the assessment arrive as one document, not two invoices.

Reading a contour map

A contour map colours the site in bands, usually of 5 dB, at a stated height above ground. The height matters more than people expect: a map at 1.5 metres describes gardens and ground floors, while a map at 4 metres describes first-floor bedroom windows, and screening that protects one frequently does nothing for the other. A single ground-level map presented for a three-storey scheme is a question waiting to be asked.

The other thing to check is what the map claims to show: an LAeq over a stated period, a night-time rating level, or a worst-hour prediction. The colours look equally authoritative either way. When we issue maps, the index, period and height sit on the figure itself, because a map that has to be interpreted by going back to the consultant has failed at its one job.

Questions

Asked often.

What software do you use?

CadnaA, which is one of the standard environmental noise modelling packages and is widely accepted by local authorities and at appeal. The software matters far less than the source data and the calibration behind it.

Do I need a model, or will a calculation do?

A single source, a clear line of sight and one or two receptors rarely needs a model. Multiple sources, significant screening, changes in level, tall buildings or a scheme-wide answer usually does. We will tell you which you need before quoting, and we do not upsell a model where a calculation is honest.

Can you model a scheme that has not been built?

That is the normal case. The model is built from drawings and proposed plant, which is exactly why it is useful: it lets mitigation be tested and layouts changed while doing so is still cheap.

Can you check someone else's model?

Yes. We review the source data, the assumptions, the receptor positions and whether the dominant sources were included at all. In our experience that last one is where the problems usually are.

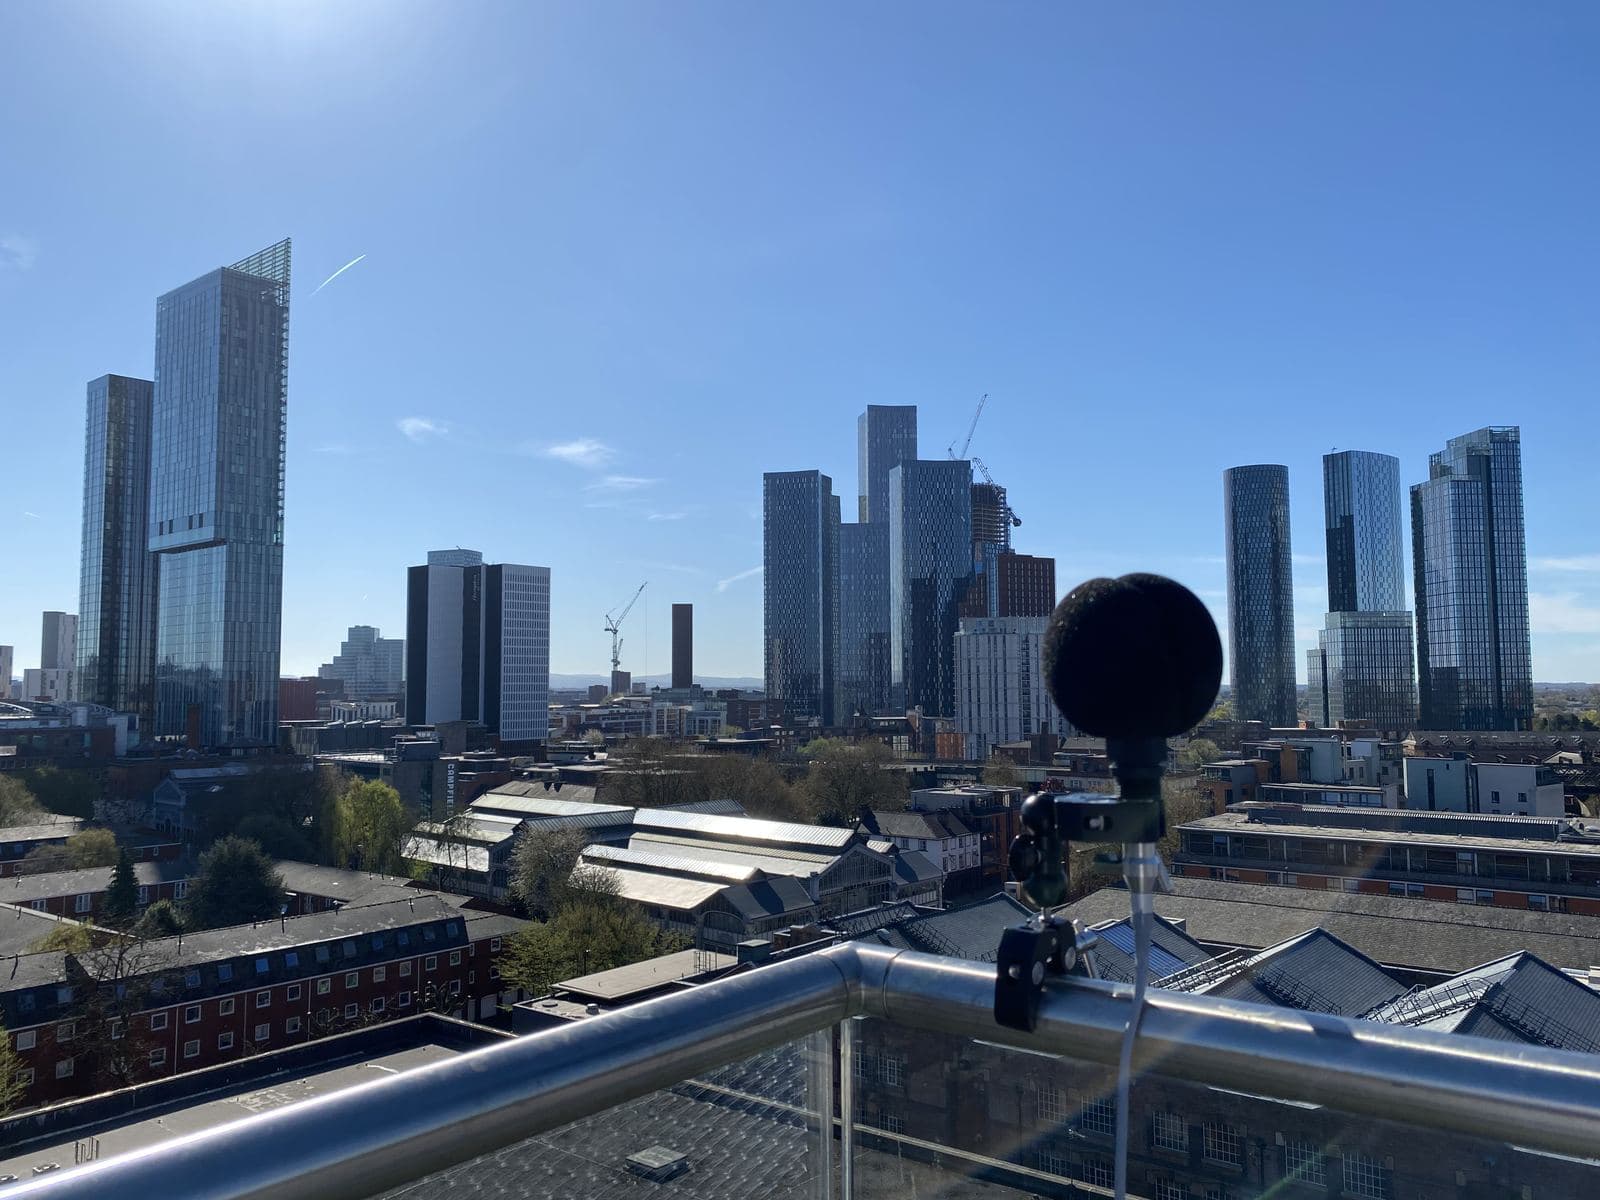
A sound level meter monitoring overnight on a Manchester rooftop

Send a postcode and a sentence.

That is genuinely enough to price most jobs. You will have a fixed quote back the same working day.